

In my original 2011 stock market forecast
I was uncertain about two possible scenarios and I decided to wait the
first week of January to make a better assessment of the odds.
What I have seen is enough to me for choosing the bearish
option but with some changes: I think this market will remain bullish
till March with only small 10/15 points corrections along its way to a
1296-1316 in a low volatility environment similar to what we experienced
over the last couple of months. We will likely see a final spike and a
distribution process during April and May with more volatility and wider
swings, during the summer a slow declining market and in September a
quite bearish month that could drag the market up to 10% lower relative
to where it started 2011 some recovery during the last part of the year
should not prevent the market to
close slightly negative for the year.
This
is my final forecast for 2011: it is based on a very specific time
cycle that I expect to be repeated, if I choose the wrong cycle it may
be totally wrong. Anyway since we do not trade on forecasts but on what
we see on the screen this will not affect our trading! Please do not
rely on it, I post it just because I promised and because someone asked
me to, it is intended to be an entertaining only exercise not an
investment or trading advice!!!! Most likely we will look at
it at the end of 2011 just to say: "OK he got it right" or to laugh
about it in case it proves to be totally wrong as
most of the long term forecasts are in the end. Short term trading is
another story, to deal with it we have other instruments. Besides
if I look back to 2010 the only two bad months were September and
December just when I had a strong negative bias that prevented me to see
that the market was simply going the other way around, if anything this
year I want to avoid such silly mistakes that are supposed to be made
only by first timers but sometimes unfortunately cannot be avoided
by the more experienced ones too....and this is the only real
advice I make here for my readers: you too should keep an open mind this
year, do not marry a forecast, a side of the market or an idea, trade
what you see .

June Update to our 2011 Stock Market Forecast
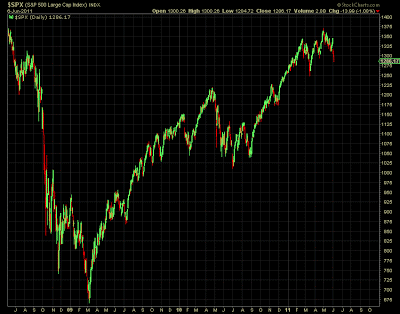
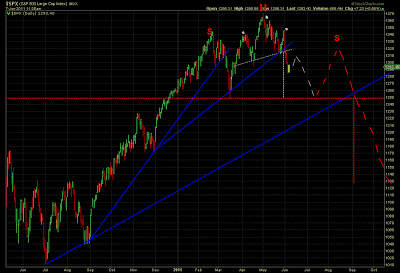 This is (as of early June 2011) how the original 2011 forecast could be tentatively fulfilled (if it right in the end...)
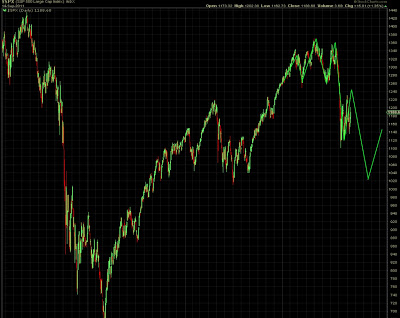
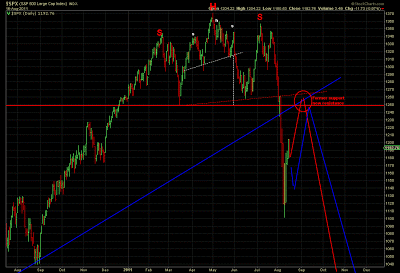 August 16, 2011 Bearish H&S pattern completed as expected now waiting for a consolidation phase
SEPTEMBER UPDATE:
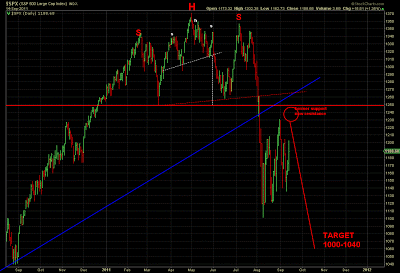 Sep. 14, 2011 Waiting for the next leg down to 1040-1000 to start as soon as the back-test is completed

 Sep
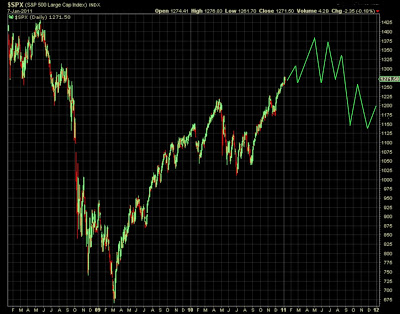
14, 2011: I have revised down the target for the next leg down to
1040-1000 to be reached as soon as the back-test of the broken support
is completed (it will fail short of it). Once the revised target is
reached the market will start a recovery into year end to close the
around 1150 if history continue to repeats itself and the cycle I am
tracking keep working as it has been working so far up to this point.
Sep
14, 2011: I have revised down the target for the next leg down to
1040-1000 to be reached as soon as the back-test of the broken support
is completed (it will fail short of it). Once the revised target is
reached the market will start a recovery into year end to close the
around 1150 if history continue to repeats itself and the cycle I am
tracking keep working as it has been working so far up to this point.
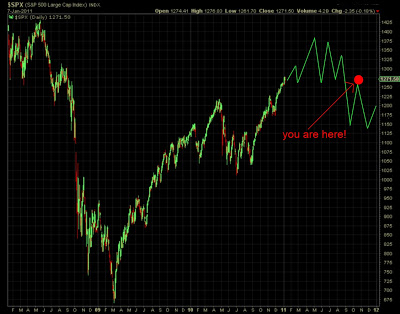

 Forecast(above) Actual (below)


Early June 2011


SEPTEMBER UPDATE:


October
25, 2011: the SPX index is trading at 1250 I expect the rebound
to fail and new lows to be printed in November with a small recovery in
December.

December
2, 2011: We saw no new lows in November but just a small drop with the
market quickly recovering by the end of November. The large picture
starts to take shape and the original forecast published in January now
is looking really non bad when confronted with the actual
market realization. The cyclical model I adopted to produce
the original forecast passed the test of time very well and it is
definitely worth working fore on it to refine it and improve it: it
correctly predicted the May 2011 top (and its level), the summer bearish
Head and Shoulder and the following drop and the base building process
of the last quarter of the year, it only failed in predicting a new low
in November.
December 29, 2011: time to review my forecast vs the actual market

